A complex visualization with line, area, and bar marks. "A recreation of William Playfair’s classic chart visualizing the price of wheat, the wages of a mechanic, and the reigning British monarch." This example covers transformation strategies for .
Mobile view
Design specification View
{"$schema": "https://vega.github.io/schema/vega-lite/v5.json","width": 900,"height": 400,"data": { "url": "data/wheat.json"},"transform": [{"calculate": "+datum.year + 5", "as": "year_end"}],"encoding": {"y": {"type": "quantitative","axis": { "zindex": 1 }},"x": {"type": "quantitative","axis": {"tickCount": 5, "format": "d"}}},"layer": [{"mark": {"type": "bar", "fill": "#aaa", "stroke": "#999"},"encoding": {"x": {"field": "year"},"x2": {"field": "year_end"},"y": {"field": "wheat"}}},{"data": {"values": [{ "year": "1600" },{ "year": "1650" },{ "year": "1700" },{ "year": "1750" },{ "year": "1800" }]},"mark": {"type": "rule","stroke": "#000","strokeWidth": 0.6,"opacity": 0.5},"encoding": {"x": {"field": "year"}}},{"mark": {"type": "area","color": "#a4cedb","opacity": 0.7},"encoding": {"x": {"field": "year"},"y": {"field": "wages"}}},{"mark": {"type": "line", "color": "#000", "opacity": 0.7},"encoding": {"x": {"field": "year"},"y": {"field": "wages"}}},{"mark": {"type": "line", "yOffset": -2, "color": "#EE8182"},"encoding": {"x": {"field": "year"},"y": {"field": "wages"}}},{"data": {"url": "data/monarchs.json"},"transform": [{ "calculate": "((!datum.commonwealth && datum.index % 2) ? -1: 1) * 2 + 95", "as": "offset" },{ "calculate": "95", "as": "y" }],"mark": {"type": "bar", "stroke": "#000"},"encoding": {"x": {"field": "start"},"x2": {"field": "end"},"y": {"field": "y"},"y2": { "field": "offset" },"fill": {"field": "commonwealth","scale": { "range": ["black", "white"] },"legend": null}}},{"data": {"url": "data/monarchs.json"},"transform": [{ "calculate": "((!datum.commonwealth && datum.index % 2) ? -1: 1) + 95", "as": "off2" },{ "calculate": "+datum.start + (+datum.end - +datum.start)/2", "as": "x"}],"mark": {"type": "text","yOffset": 16,"fontSize": 9,"baseline": "bottom","fontStyle": "italic"},"encoding": {"x": {"field": "x"},"y": {"field": "off2"},"text": {"field": "name"}}}],"metadata": {"axis": {"title": null,"gridColor": "white","gridOpacity": 0.25,"domain": false},"view": { "stroke": "transparent" }}}
View
Cicero Specification
Below, we provide one transformation rule at a time, and show the intermediate result on the side.
Specification
{"$schema": "../cicero.json","name": "vl-wheat-mobile","description": "This is a Cicero specification for 'Wheat and Wages' visualization (using Vega-Lite) from desktop to mobile.","metadata": {"condition": "small"},"transformations": [...]}
View
Rule: Resize the chart
{"description": "Resize the chart","specifier": {"role": "view"},"action": "modify","option": {"width": 350,"proportionate": false}}
View
Rule: Remove text labels
The text marks are defined as text marks.
{"description": "Remove the text marks.","specifier": {"role": "layer","mark": "text"},"action": "remove"}
View
Rule: Add a tooltip for the bar marks
{"description": "Add a tooltip for the bar marks.","specifier": {"role": "layer","mark": "bar"},"action": "add""option": {"role": "tooltip","field": ["name"]}
View
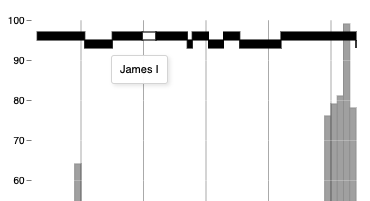
Tooltip demonstration