Erie: A Declarative Grammar for Data Sonification
Abstract
Data sonification—mapping data variables to auditory variables, such as pitch or volume—is used for data accessibility, scientific exploration, and data-driven art (e.g., museum exhibitions) among others. While a substantial amount of research has been made on effective and intuitive sonification design, software support is not commensurate, limiting researchers from fully exploring its capabilities. We contribute Erie, a declarative grammar for data sonification, that enables abstractly expressing auditory mappings. Erie supports specifying extensible tone designs (e.g., periodic wave, sampling, frequency/amplitude modulation synthesizers), various encoding channels, auditory legends, and composition options like sequencing and overlaying. Using standard Web Audio and Web Speech APIs, we provide an Erie compiler for web environments. We demonstrate the expressiveness and feasibility of Erie by replicating research prototypes presented by prior work and provide a sonification design gallery. We discuss future steps to extend Erie toward other audio computing environments and support interactive data sonification.
The List of Sonifications in this Article
- Table 3. An auditory histogram for cars.json data.
- Table 4. An auditory histogram repeated by Origin and Cylinders (in sequence).
- Table 5. An auditory histogram repeated by Origin and Cylinders (in overaly).
- Table 6. An auditory scale example for the histogram.
- Table 7. A sonification design for dataset sparsity.
- Table 9. A sonification design for kernel density estimation.
- Table 10. Sonification designs for a residual plot and QQ plot.
- Figure 2. Audio Narrative replication. Go to the example.
- Figure 3. Chart Reader replication. Go to the example.
- Figure 4. 'Nine Rounds a Second' (NYT article) replication. Go to the example.
1. Introduction
Data sonification maps data variables (e.g., height, weight) to auditory variables (e.g., pitch, loudness) [] . Sonification plays an important role in domains such as data accessibility, scientific observation, data-driven art, and museum exhibitions [] . For people with Blindness or Vision Impairment (BVI), sonification makes it possible to access data presented on screen. In science museums or digital news articles, data sonifications can support authoring more immersive data narratives by diversifying cues.
While sonification designs vary with their intended purposes, creating data sonification is often laborious because of limited software-wise support for auditory channels, compared to a robust set of expressive visualization toolkits (e.g., D3 [] , ggplot2 [] ). An ability to express diverse designs helps creators and developers to be less constrained in making their artifacts. Due to a lack of expressive tools for data sonification, however, many prior empirical works in accessible visualization rely on more hand-crafted methods (e.g., using Garage Band by Wang et al. [] ) or solution-specific approaches (e.g., Hoque et al. [] ). For example, Sonification Sandbox [] 's authoring interface for data sonifications does not support expressing a sequence or overlay of multiple sonifications. Creators of artistic sonifications or data stories need to use additional audio processing software to combine those sonifications, which requires a different set of skills. Furthermore, those tools are not programmatically available, so it is hard to apply them to use cases with data updates or user interactions. While several R and JavaScript libraries support creating data sonifications (e.g., DataGoBoop [] , PlayItByR [] , Sonifier.JS [] ), they are tightly bound to the associated visualization's chart type (e.g., histogram, boxplot) or support few encoding channels (e.g., pitch only), limiting authors' potential to compose diverse data sonification designs.
To facilitate research and tool development for data sonification, we contribute Erie, a declarative grammar for data sonification. We developed Erie with the goal of supporting independence from visual graphs, expressiveness, data-driven expression, compatibility with standard audio libraries, and extensibility with respect to sound design and encodings. At high level, Erie's syntax specifies a sonification design in terms of tone (the overall quality of a sound) and encoding (mappings from data variables to auditory features). Erie supports various tone definitions: oscillator, FM (frequency modulation) and AM (amplitude modulation) synthesizer, classical instruments, periodic wave form, and audio sampling. Authors can specify various auditory encoding channels, such as time, duration, pitch, loudness, stereo panning, tapping (speed and count), and modulation index. Authors can also use Erie to express a composition combining multiple sonifications via repetition, sequence, and overlay. Our open-sourced Erie player for web environments supports rendering a specified sonification on web browsers using the standard Web Audio and Speech APIs. Erie's queue compiler generates an audio queue (a scheduled list of sounds to be played), providing the potential for extending Erie to other audio environments like C++ and R.
We demonstrate Erie's expressiveness by replicating accessibility and general-purpose sonification designs proposed by prior work (e.g., Audio Narrative [] , Chart Reader [] , and news articles [] ). We provide an interactive gallery with a variety of example sonification designs. We conclude by outlining necessary future work for Erie, including technological hurdles, potential use cases, and blueprints for supporting interactivity and streaming data.
2. Background and Related Work
This work is grounded in research on data sonification and declarative grammars for data representation.
2.1. Data Sonification
Data sonification or audio graph encodes data values as auditory values [] . For example, Geiger counter maps ionizing radiation to the loudness of a sound. Sonification is considered as one of the primary methods for data accessibility or accessible data visualization for people with Blindness and Vision Impairment (BVI). For instance, web-based data visualization can be coupled with sonification along with alternative text descriptions. Yet, accessibility is not the only venue for sonification, but various fields, such as scientific data representation [] , data-driven art [] , and public engagement with science (e.g., learning [] , museums [] ), use data sonification.
Auditory channels. Different auditory channels, such as pitch or volume, are physicalized into a waveform. We first describe a few core concepts related to a sound wave: frequency and amplitude. The frequency of a sound wave refers to the number of wave cycles (e.g., a local peak to the next local peak) per second, and its unit is hertz (Hz). A sound with a higher frequency has shorter wave cycles, and people tend to perceive it as a higher pitch. The amplitude of a sound wave means the extent or depth of a waveform. A larger amplitude makes a louder sound.
Commonly used channels in prior work include pitch, loudness (or volume), tapping, timing, panning, timbre, speech, and modulation index [] . Pitch refers to how sound frequency is perceived with an ordered scale (low to high; e.g., Do-C, Re-D, Mi-E). Loudness means how loud or intense a sound is, often physically measured using the unit of decibel. Timing is when a sound starts and stops being played; the time interval is termed duration (or length). (Stereo) panning refers to the unidimensional spatial (left to right) position of a sound by controlling the left and right volume of two-channel stereo audio. Timbre (or instrument, put more casually) means the quality of a sound, such as piano sound, synthesizer, bird sound, etc. Modulation-based synthesizers (or synths), such as frequency modulation (FM) and amplitude modulation (AM), have two oscillators, a carrier for the main sound and a modulator that changes the carrier's waveform through some signal processing (simply put). A modulation index (MI) for such synths refers to the degree of modulation in signal processing. The frequencies of two oscillators generate the harmonicity between them.
An audio mapping of a non-categorical variable can have a positive or negative polarity. A positive polarity scale maps a higher data value to a higher audio value (e.g., high pitch, high volume), and a negative polarity scale maps a higher data value to a lower audio value. While a sonification designer should be able to specify the range of an audio scale, audio scales are capped by the physical space. For example, the common audible frequency spectrum is known to range from 20 Hz to 20,000 Hz [] .
Empirical studies in data sonification for accessibility focus on how people with BVI interpret different auditory mappings. Walker et al. [] extensively compared how sighted and BVI people perceive various auditory channels and the polarity of mappings for different quantitative data variables (e.g., dollars, temperature). Recent work extends focus to other qualities of auditory mappings. For instance, Hoque et al. [] used natural sound (e.g., bird sound) to support enhanced distinction between categorical values. Wang et al. [] show that BVI readers find certain audio channels to be more intuitive given visual encodings (e.g., pitch for bar heights) and given data type (e.g., quantitative, ordinal). In their experiment, participants indicated a need for an overview of auditory scales [] . Thus, a sonification grammar should be able to express such aspects of an audio graph design definition.
Table 1. Comparison of Erie to prior sonification toolkits. Abbreviations: VL (VoxLens and Sonifier.JS)[] , HC (Highcharts Sonification)[] , WSS (Web Sonification Sandbox)[] , SC (Soncification Cell)[] , AAG (Apple Audio Graph)[] , DGB (DataGoBoop)[] , PR (PlayItByR)[] , XS (xSonify)[] , SS (Sonification Sandbox)[] , SY (SonifYer)[] , IST (Interactive Sonification Toolkit)[] , SW (Sonification Workstation)[] , SA (SonArt)[] , L (Listen)[] , M (MUSE)[] , PS (Personify)[] , Str (Strauss)[] , Sta (StarSound)[] , SD (SODA)[] , Eq (Equalizer), Pow (Power function), Sqrt (Square-root function), SymLog (Symmetric log function).
| Category | Property | Erie | VL | HC | WSS | AAG | DGB | PR | XS | SS | SY | IST | SW | SA | L | M | PS | Str | Sta | SD | |
|---|---|---|---|---|---|---|---|---|---|---|---|---|---|---|---|---|---|---|---|---|---|
| Environment | Web | Web | Web | Web | Swift | R | R | Java | Java | Pure Data | C++ | C++ | C++ | C | Python | ||||||
| Year | 2023 | 2022 | 2021 | 2017 | 2021 | 2020 | 2011 | 2006 | 2004 | 2008 | 2004 | 2019 | 2002 | 1996 | 1997 | 1995 | 2021 | 2020 | 2014 | ||
| Data | Trans-form | Aggregate | ○ | ○ | |||||||||||||||||
| Bin | ○ | ||||||||||||||||||||
| Filter | ○ | ||||||||||||||||||||
| Calculate | ○ | ||||||||||||||||||||
| Density | ○ | ||||||||||||||||||||
| Fold | ○ | ||||||||||||||||||||
| Sound tone | Speech | ○ | ○ | ○ | ○ | ||||||||||||||||
| Instrument type | Oscillator | ○ | ○ | ○ | ○ | ○ | ○ | ○ | ○ | ○ | ○ | ||||||||||
| FM Synth | ○ | ○ | ○ | ○ | ○ | ○ | |||||||||||||||
| AM Synth | ○ | ○ | ○ | ○ | ○ | ||||||||||||||||
| Musical | ○ | ○ | ○ | ○ | ○ | ○ | ○ | ○ | |||||||||||||
| Wave | ○ | ○ | |||||||||||||||||||
| Noise | ○ | ○ | ○ | ○ | ○ | ○ | ○ | ||||||||||||||
| Natural | Via sampling | ||||||||||||||||||||
| Human vowel | Via sampling | ○ | |||||||||||||||||||
| Instrument sampling | ○ | ○ | |||||||||||||||||||
| Continuous/discrete sounds | ○ | ○ | |||||||||||||||||||
| Encoding | Freedom | ○ | ○ | ○ | ○ | ○ | ○ | ○ | ○ | ○ | ○ | ○ | ○ | ○ | ○ | ○ | |||||
| Ramping | ○ | ○ | |||||||||||||||||||
| Channels | Time-start | ○ | ○ | ○ | ○ | ○ | ○ | ○ | ○ | ○ | ○ | ○ | |||||||||
| Time-end | ○ | ||||||||||||||||||||
| Duration | ○ | ○ | ○ | ○ | |||||||||||||||||
| Speed/Tempo | ○ | ○ | ○ | ○ | |||||||||||||||||
| Count | ○ | ||||||||||||||||||||
| Pitch/detune | ○ | ○ | ○ | ○ | ○ | ○ | ○ | ○ | ○ | ○ | ○ | ○ | ○ | ○ | ○ | ○ | ○ | ||||
| Loudness | ○ | ○ | ○ | ○ | ○ | ○ | ○ | ○ | ○ | ○ | ○ | ○ | ○ | ||||||||
| Stereo pan | ○ | ○ | ○ | ○ | ○ | ○ | ○ | ○ | |||||||||||||
| Circular pan | ○ | ||||||||||||||||||||
| Timbre | ○ | ○ | ○ | ||||||||||||||||||
| MI | ○ | ||||||||||||||||||||
| Harmonicity | ○ | ○ | ○ | ||||||||||||||||||
| Reverb | ○ | ||||||||||||||||||||
| Speech | ○ | ||||||||||||||||||||
| Highpass filter | Via preset filter | ○ | |||||||||||||||||||
| Lowpass filter | Via preset filter | ○ | |||||||||||||||||||
| Envelope | Via preset filter | ○ | ○ | ○ | |||||||||||||||||
| Distortion | Via preset filter | ○ | ○ | ○ | |||||||||||||||||
| Repeat | ○ | ||||||||||||||||||||
| Custom channels | ○ | ||||||||||||||||||||
| Scale | Data type | ○ | ○ | ○ | |||||||||||||||||
| Domain/range | ○ | ○ | ○ | ○ | ○ | ○ | ○ | ○ | ○ | ||||||||||||
| Polarity | ○ | ○ | ○ | ○ | ○ | ||||||||||||||||
| Transform | Log/Pow/Sqrt/SymLog | Log | |||||||||||||||||||
| Audio filters | Biquad | High/lowpass | Eq | Eq | Eq | ||||||||||||||||
| Compressor | |||||||||||||||||||||
| Envelope | |||||||||||||||||||||
| Distorter | |||||||||||||||||||||
| Reference | Tick | ○ | ○ | ○ | ○ | ○ | ○ | ||||||||||||||
| Audio legend | ○ | ||||||||||||||||||||
| Composition | Sequence | ○ | |||||||||||||||||||
| Overlay | ○ | ○ | ○ | ||||||||||||||||||
| Repetition | ○ | ||||||||||||||||||||
| API | ○ | ○ | ○ | ○ | ○ | ○ | |||||||||||||||
2.2. Sonification Tools and Toolkits
Prior work has proposed sonification tools for accessibility support for data visualizations. For example, iSonic [] , a geospatial data analytic tool, offers various audio feedback for browsing maps, such as using stereo panning to provide a spatial sense of the geospatial data point that a user is browsing. iGraph-Lite [] provides keyboard interaction for reading line charts, and Chart Reader [] extends this approach to other position-based charts and supports author-specified "data insights" that highlight certain parts of a given visualization and read out text-based insight descriptions. Siu et al. [] propose an automated method for splitting a line chart into several sequences and adding a template-based alternative text to each sequence. Agarwal et al. [] provide a touch-based interaction method for browsing data sonifications on mobile phones. While prior sonification research has focused on use of non-speech sound, accessibility studies underscore combining speech and non-speech sound to design audio charts.
Beyond supporting accessibility, others proposed sonification toolkits created for developers or creators to directly make data sonifications. This prior tooling motivates a design space for sonification toolkits, such as the distinction between instrument and audio channels, needs for programming interfaces, and the utility of audio filters. However, existing tools often provide compartmentalized support for creating expressive and data-driven sonifications as summarized in Table 1. For example, sonification designs supported by DataGoBoop [] and PlayItByR [] are strongly tied to underlying chart type (e.g., histogram, box plot), limiting the freedom in choosing auditory encoding channels. Sonifier.js [] offers limited audio channels, time and pitch. Sonification Sandbox [] and its successors [] support more encoding channels, but developers need to use external sound editors to sequence or overlay multiple sonifications that they created using the interface, requiring a different stack of skills. Furthermore, many existing tools lack application programming interface (API) support, making it difficult for users to personalize or customize sonification designs with their preferred encoding channels or instruments. To achieve greater expressiveness with APIs, developers could use audio programming libraries, such as Tone.js [] , but they have to manually scale data values to auditory values, which can be a substantial hurdle for those with limited audio skills. These tools also lack support for scale references (e.g., tick, scale description), making it harder to decode audio graphs they generate.
Our work provides a declarative grammar for data sonification, Erie, as a programmatic toolkit and abstraction that developers can use to express a wide range of sonification designs. Erie supports various common encoding channels (time, duration, pitch, loudness, tapping, panning, reverb, and speech), verbal descriptions, tone sampling, and composition methods (repeat, sequence, and overlay), making it a good basis for use in the development of future sonification software.
2.3. Declarative Grammar
Declarative programming is a programming paradigm where a programmer provides an abstract specification (or spec) describing the intended outcome and a compiler executes to generate the outcome. In this paradigm, declarative grammar defines rules for how to write a program. Many data-related fields, such as data visualization and statistics, have widely adopted declarative grammars. In data visualization, Wilkinson [] proposed the grammar of graphics as a systematic way to describe a visualization design specification. Based on the grammar of graphics, ggplot2 [] for R and D3.js [] and Vega stacks (Vega [] , Vega-Lite [] ) for JavaScript are widely used declarative grammars for creating general-purpose data visualizations.
Declarative grammars add value by providing internal representations and compilers for user applications, particularly when directly manipulating the targeted physical space is challenging like audio environments for sonification [] . For example, some sonification toolkits (e.g., [] ) adopt visual programming languages to allow for visually and interactively authoring data sonification, and those visual programming languages are backed by some kind of declarative expressions. For example, Quick and Hudak [] provide graph-based expressions that allow for specifying constraints to automatically generate music. Implementing a sonification from scratch requires a sophisticated skill set for controlling electronic audio spaces (e.g., connecting audio filters, timing sounds, etc.). To facilitate sonification software development, our work contributes a declarative grammar for data sonification, Erie, and compilers for web environments built on standard audio APIs.
3. Gaps in Sonification Development Practices
To motivate our design of Erie with awareness of existing practices used in developing data sonification, we surveyed recently published data sonification tutorials and designs. To understand practices being shared among sonification developers, we collected nine online tutorials for coding sonifications by searching with keywords like "sonification tutorial," "audio graph tutorial," or "sonification code." To see techniques beyond tutorials, we inspected 24 data sonifications with code or detailed methodology descriptions from Data Sonification Archive that were published from 2021 through 2023. This collection included tutorials and designs created by active sonification contributors like Systems Sound and Loud Numbers. We include the list of the sonification tutorials and designs we collected in Supplementary Material. We tagged sonification tutorials and designs in terms of software or libraries used, functionality of code written by the creators (e.g., scale functions, audio environment settings), and output formats (e.g., replicability of designs, file formats). Overall, this preliminary survey identified that developers currently rely on ad-hoc approaches due to the lack of expressive sonification approaches.
Converting to auditory values then connecting to music software. Most tutorials (7 out of 9) introduced music programming libraries like music21, PyGame, Tone.js, sequenceR, Max, Sonic Pi, and MIDIFile, and most (15 out of 24) sonification designs used them. These libraries take as input auditory values like pitch notes or frequencies, volumes, and time durations. That is, developers still need to define scale functions that convert data values to auditory values, requiring an understanding of physical properties of different auditory variables. For example, the "Sonification 101" tutorial describes how to map data points to notes with a four-step procedure. First, a developer normalizes the data point into a range from 0 to 1, then multiples by a scalar to keep them in a certain range. Third, the developer specifies a list of notes to map data points to. Last, they write a for loop to convert each data point to the corresponding note from the list. On the other hand, a tutorial by Propolis introduces a linear scale function.
Then, developers need to connect those computed values to other music libraries by configuring custom instruments. To be able to create custom instruments using low-level libraries like MIDITime or Tone.js, the developer needs to have professional skills like how to import and control audio samples and what audio nodes to control to adjust different audio properties. For instance, common sonification encodings like gain, pitch, and distortion level are governed by different audio nodes. More experienced professional creators chose to use more advanced music software like Ableton Live, Supercollider, and Touch Designer that enable live performances or art installations.
Difficulty in reusing sonification designs.
Whether created programmatically or not, many existing sonification cases are
shared as multimedia files (audios or videos). This practice makes it harder
to inspect how they were created in terms of data-to-music scales, instrument
details, etc. Even if a sonification's codes are available, it is often hard
to reuse the custom code because developers have to manually inspect the code
in terms of different variable names to locate where to make changes for their
designs. For example, to change the domain, range, and transformation type
(e.g.,sqrt, log) of a certain scale, then they have to find the relevant lines
and manually change them by writing something like a linear scale function
(e.g.,
aScaleFunction(x) {return min(1600, max((log(x)-log(30))/(log(500)-log(30))*1600, 200);}), which is not always straightforward, particularly for less experienced
sonification developers. This difficulty in reusing custom code is also
widely known among visualization practitioners[]
.
4. Design Considerations
Leveraging prior empirical studies, sonification toolkits (Table 1), and development practices (Section 3), we developed the Erie grammar and compiler as a toolkit for sonification developers with the following considerations in mind.
(C1) Be independent. Many existing sonification libraries that provide APIs are strongly tied to visual forms, such that they support sonifying a particular visualization instead of authoring a sonification. While this approach can make it easy to generate sounds, it prevents sonification creators from exploring the many alternative designs one might generate by directly expressing audio graphs. Furthermore, it ignores different tasks implied by similar visualization designs. For example, point marks can be a scatterplot for assessing correlation or a residual plot for judging model fit, potentially calling for different sonification designs. We designed the Erie grammar to be independent of visual forms to maximize design possibilities.
(C2) Be expressive. To support independently creating various sonification designs, it must be possible to express different sound qualities, auditory channels, and combinations of multiple sonifications. Expressive toolkits enable researchers and developers to navigate a variety of design ideas. Thus, Erie supports specifying different sound designs (e.g., instrument types, discrete vs. continuous sounds) and different auditory channels for data encoding, and also allows for specifying sonification sequences and overlays.
(C3) Be data-driven. Sonification can be a useful tool for enhancing presentations of data in other modalities (e.g., visualization), in addition to standing on its own. Creating sonification often starts with implementing ad-hoc functions to convert data to audio properties as shown earlier. Under the assumption that Erie's users may have limited understanding and skill with respect to acoustic engineering and audio programming, it makes more sense to be able to declare data-to-audio conversions with a few configuration terms. Consequently, we designed Erie's syntax to express data instead of sound by leveraging the grammar of graphics[] and its popular implementations[] , such as their scale expressions for encoding channels.
(C4) Be extensible. A toolkit may not be able to support all potential cases in advance, particularly when the design space is unlimited. Erie allows for sampling audio files, configuring FM and AM synths, and defining periodic waves (combining multiple sine and cosine waves). Furthermore, Erie provides a method to define and connect custom audio filters (e.g., distortion, biquad filters) that can have extra auditory encoding channels.
(C5) Be compatible with standards. The expressiveness and extensibility criteria are constrained by specific audio environments. As different display media affect the resolution of images, sound representations are highly sensitive to audio environments, such as processing capacities and equipment. Thus, compatibility with the standards of a targeted environment is critical, similar to how we use SVG or Canvas for web visualizations. We consider two standards for sonification: (1) physical units and (2) rendering standards. First, Erie's queue compiler generates a scheduled list of sound items using standard auditory units (e.g., Hz and musical notes for pitch, the panning range from to ) so as to be used in other audio environments (e.g., external music software). Our Erie player for web employs the Web Audio and Speech APIs to enable cross-browser experience.
5. Erie Grammar
We formally describe the syntax of theErie grammar to show how Erie is designed to be expressive (C2) and data-driven (C3). At a high level, Erie expresses a sonification design using a sound instrument (tone) and mappings from data to auditory values (encoding channels). After walking through an example case, we describe how Erie expresses a data sonification design, including top-level specification, stream, data input and transform, tone, encoding, stream composition, and configuration. The formal definition of Erie is provided in Figure 1. In describing Erie, we distinguish developers who create sonifications from listeners who listen to sonifications. For details, refer to the Appendix and the documentation. in the Supplementary Material.
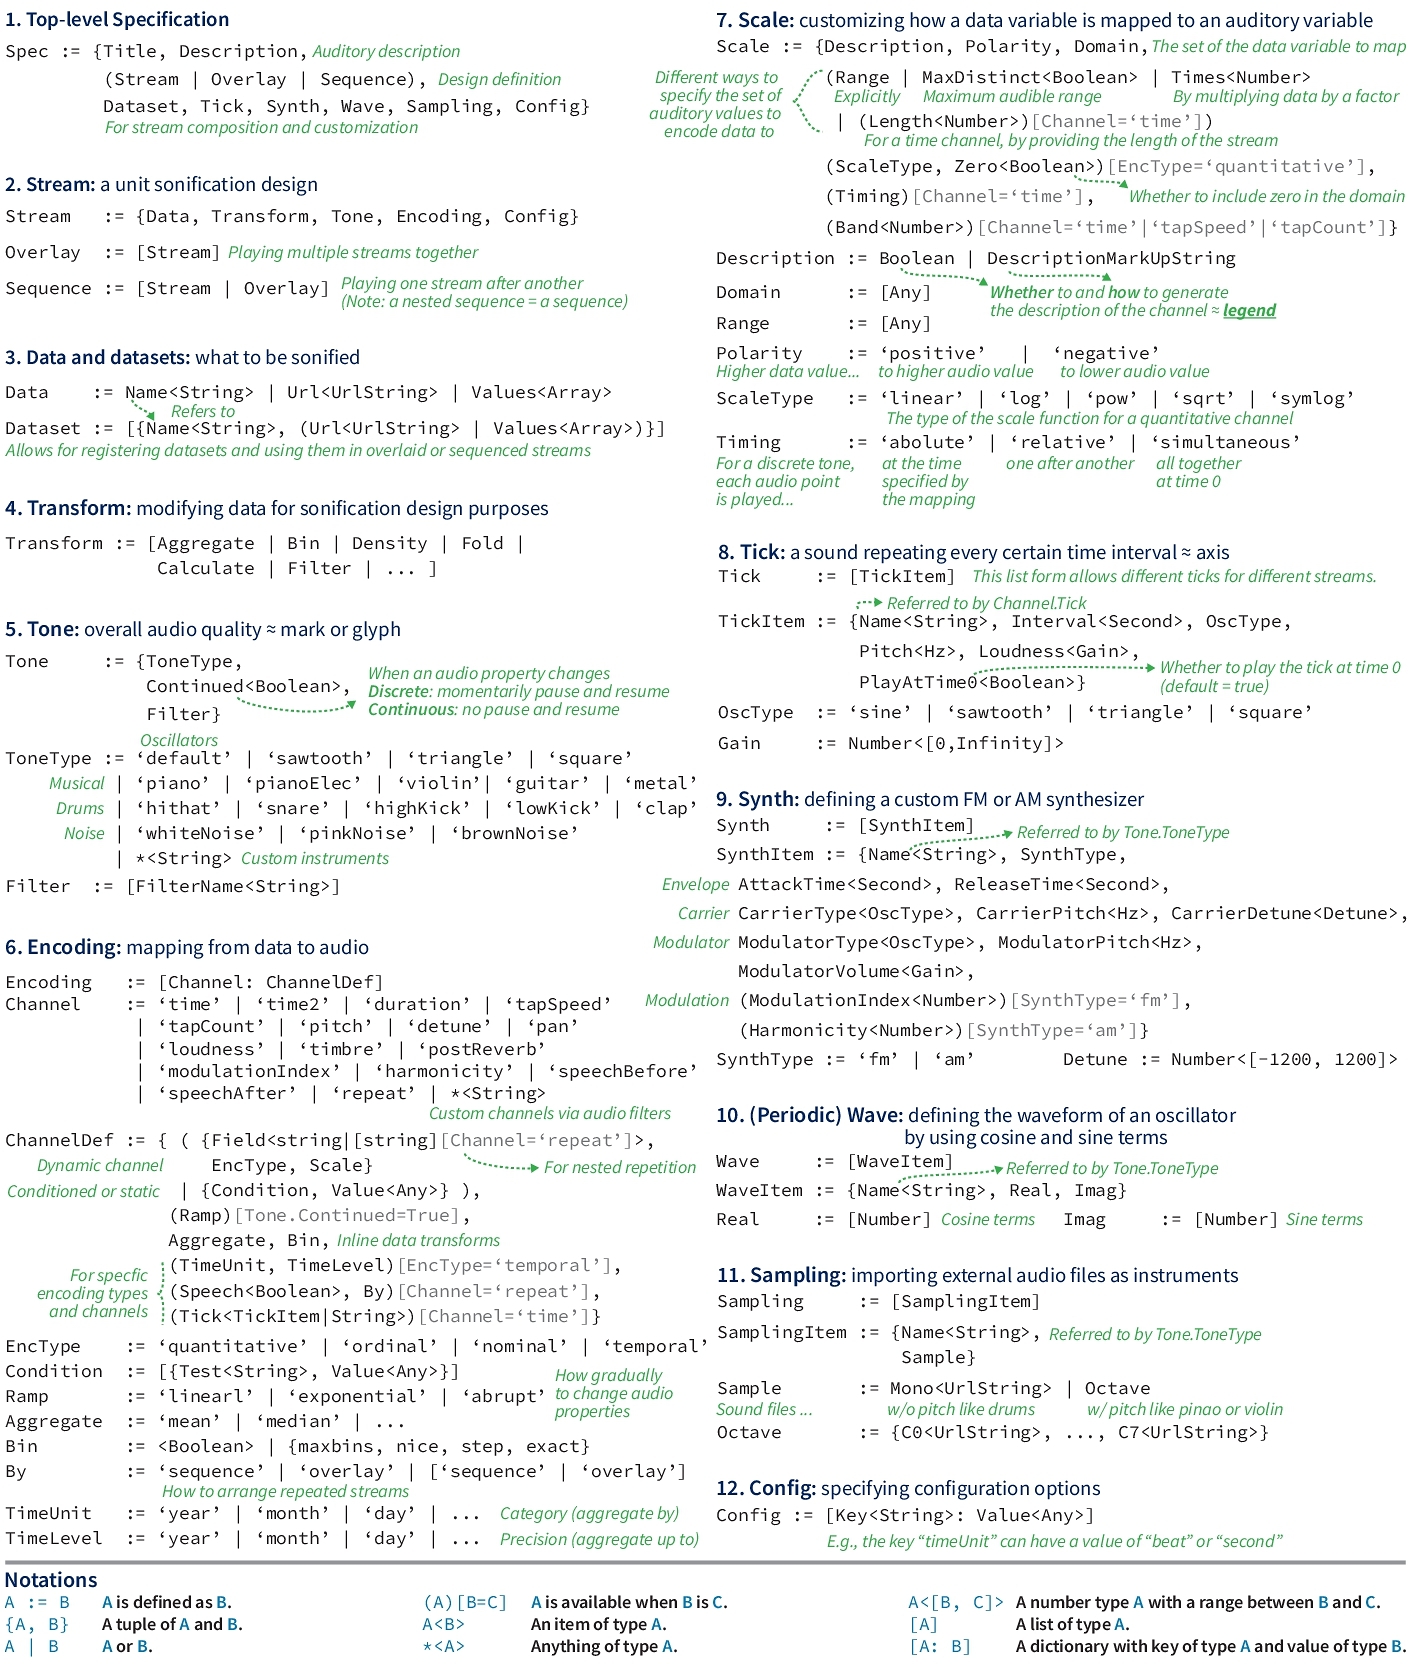
Figure 1. The formal definition of Erie. For applicable elements, roughly analogous visualization elements are denoted by signs. PDF version
5.1. A Walkthrough Example
To help imagine how Erie works in specifying a sonification design, we introduce a simple auditory histogram for a quantitative data variable, miles per gallon with a range from five to 50, from a 'cars.json' dataset [] . In this sonification, miles per gallon is discretized into nine bins by five miles, and the bins are communicated by mapping them to time. The count (aggregation) of each bin is mapped to pitch.
To construct this example using Erie, we first specify the data to sonify by providing its URL:
Table 2. The results of data transforms in Section 5.1.
| miles−per−gallon−bin | miles−per−gallon−bin−end | count |
|---|---|---|
| 5 | 10 | 1 |
| 10 | 15 | 52 |
| 15 | 20 | 98 |
| 20 | 25 | 78 |
| 25 | 30 | 77 |
| 30 | 35 | 56 |
| 35 | 40 | 27 |
| 40 | 45 | 8 |
| 45 | 50 | 1 |
Second, we need to define how to sonify the specified data in terms of overall qualities (tone) and auditory mappings (encoding). We indicate that the sound should be segmented or discrete:
Lastly, the above expressions are combined into a spec as:
Table 3. The sonification output for an auditory histogram in Section 5.1. Units: seconds (start, end, duration) and Hz (pitch). "Sine" means a sinusoidal oscillator. The results of data transforms in.
Audio graph specification
Audio Graph Player
Audio queue list
Visualization
5.2. Top-Level Specification and Stream
We first define a simple, single data sonification specification inErie (a spec, hereafter) as a tuple of stream, dataset, tick, synth, wave, sampling, title, description, and config:
5.3. Data, dataset, and Transform
A sonificationstream must have data to sonify, and Erie supports three methods to do so: providing the URL of a data file, providing an array of values, or providing the name of a predefined dataset in the dataset object.
5.4. Tone
To set the baseline sound of a sonification stream, a developer needs to specify the soundtone. A tone is roughly analogous to a mark or glyph in a visualization given that data values are mapped to its properties like pitch. Erie expresses the tone of a stream using an instrument type (e.g., piano, FM or AM synth), an indicator of whether a sound is continued, and a set of audio filters.
5.5. Encoding
Theencoding of a stream defines how data variables are mapped to different auditory properties (e.g., pitch and loudness) of a tone. Erie supports three classes of channels: dynamic, conditioned, and static. A dynamic channel encodes a data variable (or field) to the respective auditory property. It is defined in terms of a data field from the stream's data, the data type of an encoding (enc-type), its scale details, its ramping method, and inline data transform options (aggregate and bin):
A developer may need to emphasize certain data values by making them sound different instead of encoding every data value using a scale. In the walkthrough, suppose that the developer wants to indicate bins with more than 80 counts using a louder sound. Supporting such cases, a conditioned channel has a condition list for special values and a value for the others.
5.5.1. Scale
Thescale of a dynamic encoding channel essentially consists of the domain (data values to map) and range (audio values to be mapped) of the mapping. From the walkthrough, the domain of and the range of of the pitch channel compose a linear function . There are shortcuts for defining a range. When max-distinct is set to true, then the widest possible range is used (e.g., the lowest to highest human-audible pitch). The times multiplies each data value by itself to compute auditory values. To verbally describe the scale, a developer can provide description using a markup expression (see Appendix A.2.3), analogous to a legend in a visualization. A baseline scale is formally defined as:
5.6. Composition
Combining multiplestreams is necessary to create rich auditory data narratives (e.g., [] ). For example, a stream for vote share can be repeated to provide statistics for different regions. Alternatively, two streams, one for vote shares and one for the number of elected officers in a certain region, can be sequenced to deliver more information about election results in the region. Streams for different polls can be overlaid to support synchronized comparison. Erie supports expressing data-driven repetition and concatenation-based composition.
5.6.1. Data-driven repetition: Repeat channel
Data analysts commonly examine a measure conditional on one or more categorical variables. For instance, the developer may want to extend the walkthrough case by replicating the auditory histogram by theorigin of manufacture (i.e., three histograms for U.S.A., Japan, and Europe). To support such cases, a repeat channel defines how to repeat a stream design by one or more data fields. From the previous example, the developer can repeat the auditory histogram by the origin and the number of cylinders (values: 3, 4, 5, 6, and 8):
Table 4. The sonification stream order for the auditory histograms repeated by the origin and cylinders variables.
Audio graph specification
Audio Graph Player
Audio queue list
Visualization
Suppose the developer now wants to simultaneously play (i.e., overlay) the auditory histograms for different cylinder values to reduce the playtime. To do so, the developer can use the by property in the repeat channel:
Table 5. The sonification stream order for the auditory histograms sequenced by the origin field and overlaid by the cylinders field.
Audio graph specification
Audio Graph Player
Audio queue list
Visualization
5.6.2. Concatenation: Sequence and overlay
Two or more separatestreams can be combined as a sequence (playing one after another) or an overlay (playing all together at the same time). To enable these multi-stream compositions, we extend the definition of a stream:
5.7. Configuration
Aconfig object specifies overall controls for the sonification. For example, when a sonification consists of multiple streams that use the same auditory encodings and scales, the developer can skip playing the scale descriptions for the non-first streams. When a sonification needs more musical representation, a developer can change the time-unit from seconds (default) to beats. For background, when BPM is 100, one beat corresponds to 0.6 seconds (). In this case, the developer can specify the tempo (beat per minute, or BPM) and whether to round raw beats to integer beats (e.g., 3.224 to 3). When the time unit of sonification is set to beats, then other time-related units are also accordingly converted. For instance, the unit for a tap-speed channel becomes taps per beat.
6. Erie Compiler and Player for Web
A family of compilers and renderers for declarative grammar produces the output as expressed in a design spec. ForErie, a queue compiler compiles a spec to an audio queue representing a schedule of sounds to be played in terms of their physical values. Then, a player renders this audio queue into actual sounds. We separate the queue compiler from the player to allow listeners to control when to play or pause a sonification and to support developing players for different audio environments, such as CSound [] . We implemented and open-sourced a spec API, a queue compiler, and a player for a web environment using web standard APIs in JavaScript (C5: Compatibility with standards).
6.1. Supported Presets
Compilers and renderers of declarative grammar often provide default presets. Erie compiler and player offer the following presets.
Data and data transform. Erie's compiler supports multidimensional data in a relational table form (e.g., CSV, JSON). Since we assume that a developer has done fundamental data processing and transforms (e.g., fitting a regression model), our compiler supports a minimum set of data transform types that include aggregation, binning, kernel density estimation, folding (columns to rows; e.g., ), filtering, and calculation.
Instrument types. Our web player supports musical instruments (classical piano, electronic piano, violin, guitar, metal guitar, clap, hi-hat, high-kick, low-kick), noises (white, pink, and brown), simple oscillators (sine, sawtooth, triangle, and square forms), configurable FM and AM synths, and periodic waves.
Audio filters. Our web player offers preset filters such as a dynamic compressor, a distortion filter, an envelope node, and various types of biquad filters. These filters can be chained in the tone of a stream.
Encoding channels. Our queue compiler handles time, time2, duration, tap-speed, tap-count, pitch, detune, pan, loudness, timbre, post-reverb, modulation index, harmonicity, speech-before, speech-after, and repeat channels. Different audio filters can have extra encoding channels. For example, a lowpass biquad filter attenuates frequencies above a certain cutoff, and it can have a biquad-frequency channel to set the cutoff.
Scale descriptions. Erie's queue compiler generates a description of each scale to give an overview of the sonification. A scale description functions as an auditory legend in a sonification. For example, the scales of the time and pitch channels from the walkthrough is auditorily described as shown in Table 6.
Table 6. The default scale description provided by Erie for the walkthrough case. These items are played before the sonification in Table 3 by default.
Audio graph specification
Audio Graph Player
Audio queue list
Visualization
6.2. Spec API
We implementedErie syntax in JavaScript. For example, the spec of the walkthrough can be written as below.
This spec is equivalent to the following JSON object, which can be
obtained via the get method of the spec API. This JSON syntax
reuses some Vega-Lite []
expressions,
supporting cases where visualization and sonification need to be provided concurrently.
6.3. Queue Compiler
Given a spec, our queue compiler converts data values to auditory values.
The outcome audio queue is an ordered list of sub-queues, and each
sub-queue item can have one of these four types:speech,
tone-series,
tone-speech-series, and tone-overlay. A speech
queue consists of natural language sentences that are played one after another.
A tone-series queue is a timed list of non-speech sounds, and a
tone-speech-series
queue is a timed list of sounds and speeches. Each sound in a sub-queue of
these two types is expressed in terms of their actual auditory values (e.g.,
Hz for pitch). Lastly, a
tone-overlay
queue consists of multiple tone-series queues that are played
simultaneously. An audio queue is not nested except tone-overlay
queues, and a sequence spec is compiled to multiple flattened
sub-queues. To compile a spec into an audio queue, a developer can run
compileAudioGraph
function, which asynchronously compiles the spec to an audio queue:
6.4. Player for Web
We developed anErie player for web environments using the standard Web Audio API [] and Web Speech API [] . The player offers several playing options: play from the beginning, pause, resume, stop, play from a sub-queue, and play from one sub-queue to another.
6.5. Filter and Channel Extension
To achieve certain sound effects, a developer could use audio filters in
addition to custom instruments (e.g., configured synth, sampling).
Furthermore, those audio filters can encode data variables (e.g., the
amount of distortion to express air quality). To widen such design
possibilities,Erie
offers APIs for defining custom audio filters that can have additional encoding
channels (C4: Extensibility). To describe the process of
defining a custom filter, imagine that a developer wants to add an
envelope filter with encodable attack and
release
times.
Attack means the time duration from the zero volume at the
beginning of a sound to the highest volume, and release
refers to the time taken from the highest volume to the zero volume at the
end of the sound []
. The developer
first needs to define the filter as a JavaScript class that
can be chained from a sonification sound to an output audio device. This
class should have
connect
and disconnect methods to enable the chaining, following the
Web Audio API syntax []
. Then, the
developer needs to define an encoder function that assigns
the
attack
value for each data value to the filter and a finisher
function that assigns the release values to the filter. Refer
to the documentation in our Supplementary Material for technical details.
7. Demonstration
To demonstrate Erie grammar's independence from visualization (C1) and expressiveness (C2), we walk through novel examples. We also replicated and extended prior sonifications to show the feasibility of our compiler and player for sonification development. In addition to the below examples, more use cases, such as a confidence interval, histogram, and sonification of COVID-19 death tolls, are available in our example gallery.
7.1. Example Sonification Designs
We show three representative example cases to show how Erie can be used.
7.1.1. Data sparsity
Given five data tables named A to E, suppose we want to identify and
compare their sparsity (the portion of cells that are empty) using a
tap-speed channel. We have a nominal variable, dataset name, and a quantitative variable, sparsity, and the data
looks like Line 1–6.
Now, we want to map the name field to the
time
channel of a sonification and the sparsity to the
tapSpeed
channel, so that a sparse dataset with a higher sparsity value has slower
tapping. First, we create a single-stream sonification spec object and
set a description text (Line 7–9). Then, we assign the
data
to this spec (Line 9). With a default sine-wave
oscillator, we need a discrete tone to represent separate data tables,
which can be specified as Line 10.
Next, we set the time encoding channel as described
earlier (Line 11). This time channel should
use relative timing to allow for playing each data table name before
the sound for the corresponding sparsity value (Line 12).
We then specify the tapSpeed channel for the quantitative
sparsity channel (Line 13). This tapSpeed
channel has the domain of . We want to map this
domain to the range of (i.e., zero to five taps
per second) for 2 seconds (Line 14). Since a higher
sparsity value should have a lower speed, we need negative
polarity (Line 15). This results in a single
tap sound for the sparsity value of . To play this
sound in the middle of the time band (two seconds), we
set the
singleTappingPosition
property as middle (Line 16). To support
identifying these tapping sounds at different speeds, we need a
speechBefore
channel for the name channel (Line 17) We do
not need a scale description for this speechBefore
channel in this case (Line 18).
Table 7 shows the audio queue compiled from
this spec.
Code
Table 7. The audio queue resulting from a sparsity
sonification spec in Section 7.1.1.
after_previous
means "play after the previous sound" within the same sub-queue. A tapping pattern,
, means a tap sound for seconds and a pause for seconds are repeated times (the last pause is omitted).
Audio graph specification
Audio Graph Player
Audio queue list
Visualization
7.1.2. Kernel density estimation
In exploratory data analysis pipelines, examining the distributions of
variables of interest is a common first step. It is important to observe
the entirety of a distribution because some distributional information,
such as multi-modality, are not captured by summary statistics like mean
and variance. In addition to histograms, data analysts often estimate the
probability density of a quantitative variable using a kernel smoothing
function (i.e., kernel density estimation or KDE). In this example, we
want to sonify a KDE of the bodyMass variable of the
penguins.json
data []
. This sonification will encode
the density by pitch and the variable's value by time and panning. Then,
we repeat this sonification design for different species and
islands of penguins.
The penguins.json dataset consists of species,
island, and bodyMass fields. The nominal
species
and island fields form five combinations as shown in the
first two columns of Table 8. The
bodyMass field roughly ranges from 2,500 to 6,500.
Table 8. A preview of the penguins.json dataset.
species | island | bodyMass |
|---|---|---|
| Adelie | Torgersen | 3,750 |
| Adelie | Biscoe | 4,300 |
| Adelie | Dream | 2,900 |
| Chinstrap | Dream | 3,450 |
| Gentoo | Biscoe | 6,300 |
First, we create a single-stream spec object, set the description, and
assign the data (Line 1–3). Next, we need to add a
density
transform for the KDE of the
bodyMass
field grouped by species and island (Line 4–6). This transform results in a new data table that has four columns:
value
(evenly distributed bodyMass values, e.g., 2500, 2550,
..., 6450, 6500), density (the density estimate of each
value
element), species, and island. Third, we use
a
continued
tone because we want to sonify continuous KDEs (Line 7).
Given this tone design, we set the time,
pan, and pitch channels. We map the
value
field to time and pan to give both temporal
and spatial senses of sound progression (Line 8–9). Then,
we detail the scale of the time channel by
setting the length of each repeated sound to three
seconds and indicating the title of this
scale
in the scale description (Line 10). Similarly, we set the
polarity
of the pan channel to positive and note the
same scale title (Line 11). We encode the
density
field to the pitch channel with positive polarity
and a pitch range of
[0, 700]
(Hz) (Line 12–14). KD estimates usually have infinite
decimals (e.g., ), which makes it
hard to understand when read out (e.g., in the scale description). To
prevent reading all the decimals, we specify the read
format
of the density estimates so that they are only read up to the fourth decimal.
Erie uses format expressions supported by D3.js []
(Line 15). Now, we repeat this spec design by the
species
and
island
fields using a repeat channel (Line 16–17).
Table 9 illustrates the audio queue compiled from
this spec. Sub-queue 4 to Sub-queue 8 are the scale descriptions for the
time, pan, and pitch channels
with audio legends. Sub-queues 10 to 24 represent the specified KDE
sonification for each combination of the species and
island values.
Table 9. The audio queue resulting from a kernel density estimate sonification spec in Section 7.1.2. The pitch values (range from 0 to 700) are low because they are representing the both-side tails of each estimated density distribution.
Audio graph specification
Audio Graph Player
Audio queue list
Visualization
7.1.3. Model fit sequence
After fitting a linear regression model, a necessary task is to check the
model fit by examining the residuals. Common methods for residual analysis
include a residual plot (residual vs. independent variable) and a QQ plot
(residual vs. normal quantile). For this task, we assume that we have
already fitted a linear regression model of Sepal Length on Petal Length (
), and computed the residuals. For the residual plot, we use a
residuals
dataset with two fields:
sepalLength
(independent variable) and residuals. For the QQ plot, we use
a
qq
dataset with two fields: normalQuantile and
residualsundefined. With these datasets, we want to create two sequenced
sonifications for residuals and comparison to normal quantiles (i.e.,
recognizing their trends).
We first register the datasets (Line 1–6). Second, we
define a sonification for a residual plot. When errors of a model fit
are unbiased, the residuals are evenly distributed along values of the
independent variable and on both sides of the central line indicating
0 error. With this residual plot sonification, we want to capture the
evenness of residual distribution by mapping the residuals to
modulation
index and pan channel. In this way, a larger residual is
mapped to a more warped sound, and a negative residual is played on
the left side and a positive residual is played on the right side. A
good model fit will generate a sonification where the sound quickly
(e.g., 150 sound points within 5 seconds) moves between different
modulation index and pan values, making it harder to differentiate
their degrees of warping and spatial positions. In contrast, a bad
model fit will generate an audio graph where listeners can easily
sense some groups of sounds sharing the same degree of warping on a
certain spatial position. We use a time channel for the
sepalLength field.
To do so, we create a single stream with the residuals
dataset (Line 7–9). For the tone, we use an FM synth,
named
fm1
(Line 10–12). The residual sonification uses a
time
channel for the
sepalLength
values and modulation index and pan channels
for the residuals that roughly range from to . This design is specified as Line 13–18.
Next, we specify a QQ plot sonification. A good model fit should also
exhibit normally distributed residuals. By plotting the quantiles of
the residuals against the expected quantiles of a normal distribution
(range from 0 to 1), we want to observe how much the residuals deviate
from the expectation that they are normallly distributed. A visual QQ
plot shows the gap between the theoretical and observed distribution
by plotting them in a Cartesian space, which is the same format used
for a residual plot at high level. However, a sonification author may
need to directly encode the gap because overlaying the normal and
residual distributions with different pitches or volumes may make it
harder to decode the gap, indicating the need for specifying a
sonification design independently from visualization (C1). Thus, we compute the normalized residuals' deviation
(within 0 to 1) from normal quantiles to directly encode the gap. This
transform is done using the below calculate transforms,
resulting in two additional fields: normalized and
deviation
(Line 19–25).
Then, we map the normalQuantile to time, the
magnitude of the residual to pitch, and the
deviation
to pan. These mappings will produce sounds that are
spatially centered when the deviation is smaller but are played from
left or right when the signed deviation is bigger (Line 26–33).
Lastly, we merge the residual and QQ streams (residualSpec,
qqSpec) into a sequenced stream (Line 34–35).
This spec results in the sonification described in Table 10.
Table 10. The audio queue resulting from a model fit sonification spec in Section 7.1.3. "Q" indicates the index of each sub-queue.
Audio graph specification
Audio Graph Player
Audio queue list
Visualization
7.2. Replication of Prior Use Cases
We replicate several sonification use cases (e.g., applications and data stories) and extend their features to demonstrate how feasibly creators can use Erie in development settings. We include the Erie specs used for the below replications in our example gallery.
7.2.1. Audio Narrative
Audio Narrative []
divides a temporal
line chart into segments that represent different data patterns, such as increase,
decrease, and no change, and offers a sonification and speech description for
each segment. To show how Erie can be used in such applications
to generate sonifications, we created an example case that Audio Narrative
could create by using Erie for sonification and speech
generation, as shown in Figure 2. We used a
'stocks.json'
dataset []
for this replication. We use two
variables, stock price and date, from this
dataset.
Figure 2. Our replication and extension of Audio Narrative [] using Erie. In addition to the originally offered sequencing and speech description, we included options for using different encoding channels (A) and playing the scale description (B). Go to the example
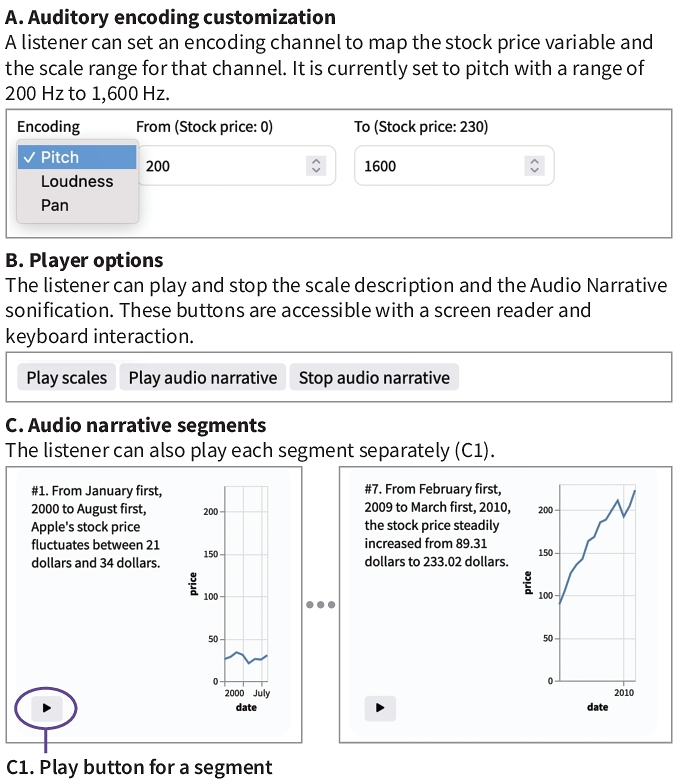
Suppose an Audio Narrative-like application already has a line chart segmented and relevant speech texts generated. The next task is to create sounds for those segments and speech texts. Using Erie, the application can simply write a sonification spec for each segment as below:
By setting adescription, the application can play the speech
for each segment. Having the above as a template, the application then
merge the specs for all the segments as a sequence:
The forceSequenceScaleConsistency in the config
forces the segment streams to use the same pitch scale. As
sonifications can benefit from the user's ability to personalize design
choices []
, we extend this Audio
Narrative case by allowing for using a loudness or pan channel to encode a
variable and adjusting the scale range of those channels. Furthermore, we
add an option that separately plays the scale descriptions of a
sonification.
Erie supports this by using a skipScaleSpeech option
in the config. 7.2.2. Chart Reader
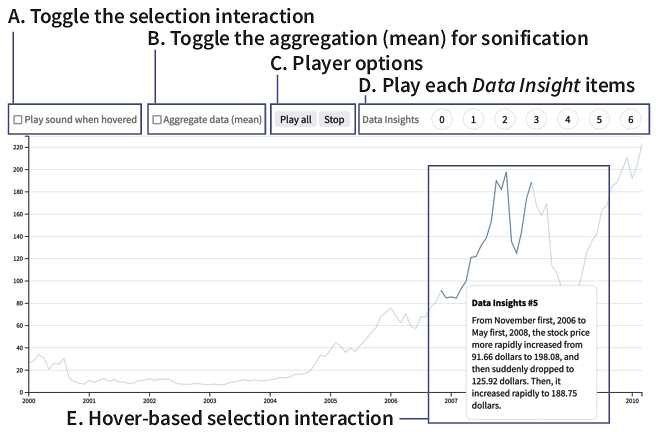
Given a visualization, Chart Reader [] enables hover interaction that reads out values and generates a sonification for the selected data mark(s). Furthermore, Chart Reader supports creating several "data insights" that allow a sonification author to draft more customized text messages, similar to the chart segments supported by Audio Narrative. We replicate this use case by reusing the above Audio Narrative replication, given their underlying structural similarity (segmentation of a chart with descriptive text), as shown in Figure 3.
Figure 3. Our replication and extension of Chart Reader [] using Erie. We further included user options for toggling the hover/selection interaction (A) and aggregation (B). Go to the example
In this case, the sonification and description text of a chart segment is
played whenever the corresponding part in the chart is selected, or the
button for the segment is triggered via a mouse or keyboard. This uses the
same segment template spec as Audio Narrative replication, but they are
not sequenced. We set the pitch scale's domain as the minimum
and maximum values of the sonified variable so that the segments can share
the same pitch scale even though they are not sequenced in the same specification.
This technique is often used in data visualization cases as well. We further
include several customization options for toggling the hover interaction and
data aggregation. By reusing the above sequence, we also include an option
to play all the `data insight' segments.
7.2.3. Nine Rounds a Second
The Nine Rounds a Second article [] covers the mass shooting case in Las Vegas in 2017 where the gunman was known to have had a rapid-fire gun. This article compares the Las Vegas case with the mass shooting case in Orlando in 2016 and the use of automatic weapons. In this article, a dot plot visualizes the shooting count over time to show how fast shots were fired. To make it even more realistic, the authors of this article included a sonification that mimics actual gun sounds.
We replicate this news article sonification by mapping the shooting time
to a time channel and the three cases (Las Vegas, Orlando,
and automatic weapon) to a repeat channel, as shown in Figure 4. We use an electronic drum's clap sound that
Erie's player supports as a preset because it sounds similar to a
gunshot sound. The original article had an interaction that when the name
of a case is selected, it plays only the relevant part. To support that,
we use the audioQueue.play(i, j) method, so that the player
only plays from the i-th sub-queue to j-th
sub-queue. In this case, the first sub-queue is the name of a case, and
the last sub-queue is the sonification sound (two sub-queues in total).
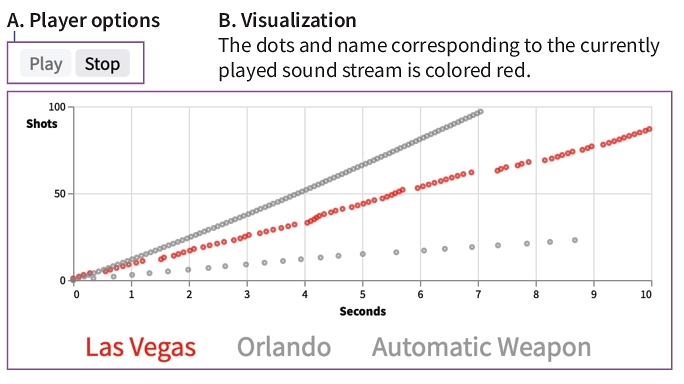
Figure 4. This figure has two sections, A and B. (A). Player options. Two buttons for Play and Stop. (B). Visualization. The dots and name corresponding to the currently played sound stream are colored red. The visualization is a scatterplot for three categories, Las Vegas, Orlando, and Automatic Weapon. Each dot indicates the time and index of a gunshot in each category. The dots for Las Vegas are colored red. They exhibit a long, increasing pattern with short between-dot distances. The dots for Orlando are fewer and more spread with larger between-dot distances. The dots for Automatic Weapon has a highly regular pattern with the same, short between-dot distances. This indicates that the distribution of the Las Vegas dots resembles that of the Automatic Weapon dots. Go to the example
8. Discussion
We contribute Erie, a declarative grammar for data sonification, with five design goals: independence as a sonification grammar, expressiveness, data-driven syntax, compatibility with audio standards, and extensibility of functionalities. Below, we briefly discuss remaining technological challenges, and then we motivate future sonification research that could use Erie.
8.1. Technological Hurdles
While developing Erie, we faced two major technical hurdles in using the Web Audio and Speech APIs. First, there is no standard API that can capture (i.e., generating pure audio files from the source) the sound generated using those APIs. Instead, users need to use third-party audio capture applications or record sound as it is being played out of the device (which also records room noise and causes distortions due to audio feedback). Thus, we implemented a workaround Chrome extension using Chrome-specific APIs. Second, speech sounds generated using the Web Speech API cannot overlap which limits Erie's expressiveness, such as the potential to overlay different streams with speeches and tones. Thus, related technological extensions to those APIs could help express a more diverse set of audio graphs.
8.2. Potential Use Cases of Erie
We expect our implementation of Erie (compiler, player, and extension APIs) to facilitate various future work on data sonification research and tooling. In addition to the use cases like sonification for detecting model fit (which might be extended to properties like model convergence), sonification authoring applications, and popular media (Section 7), future sonification research could use Erie to ask questions related to, for example, perceptual intuitiveness and effectiveness of different sonification strategies (e.g., [] ). Given that sonification design specs expressed in Erie can be parameterized as a declarative grammar, sonification researchers could use Erie to more systematically generate different stimuli according to their experiment conditions. Such research will expand understanding around which audio graph formats are best suited for different tasks or auditorily pleasant, providing foundations for building intelligent tools like sonification recommenders. Furthermore, future sonification tools for data analysis or narrative authoring could use Erie as their internal representation to maintain user-specified designs. To support sonification researchers and developers to test out Erie, we provide an online editor for Erie.
8.3. Future Work
Erie is our first step of an expressive declarative grammar for data sonification. Future work should extend Erie to support more dynamic use cases, such as interactivity, streaming data, and different audio environments.
Interactive sonification. Interactivity is often necessary for data analysis because one static data representation cannot provide a full picture. While it is possible to use Erie in interactive user interfaces with customizability as we demonstrated (Section 7.2), Erie could better support interactive data sonification with native expressions. A prerequisite to developing an interactive grammar for data sonification is some understanding of how a sonification listener would trigger a user interaction and receive its feedback using different modalities. For instance, various approaches to using a keyboard, speech recognition, tabletop screens, or mobile haptic screens for interactive sonification are fruitful topics like personalized sonifications for future research to explore (e.g., [] ).
Expressing sonifications for streaming data. Sonification has been used for various real-time streamed data from traditional Geiger counters to audio graphs for physics [] . While it is relatively simple for visualization to show existing data points and newly received data points, sonification-based tools may need to build a notion of "existing" given the transient characteristic of sound. For example, a visualization dashboard can express newly received data by adding corresponding visual marks, and the viewers can easily compare them with the existing visual marks. However, a sonification monitor may need to play sounds for some past data points, announce the auditory scales, or use notifications for some signals, depending on the task that the listeners want to achieve. Thus, future work should ask how to indicate and contextualize newly arrived data points, what portion of existing data points should be played again if needed, and how to auditorily imply that a system is waiting on new data.
Supporting different audio environments. Data sonification can also be useful for other environments like statistical programming and server-side applications. For example, Erie player for R Studio (a popular integrated development environment for R) could benefit building tools for statistical sonifications like those described above. As R Studio is backed by Chromium (the same web engine for Chrome and Edge), Erie's web player may need to be extended slightly to support this environment. To support server-side production of data sonifications, direct generation of raw pulse-code modulation data (digital representation of analog signals) [] would be useful.
Intelligent authoring tools for data sonification. As a declarative grammar, Erie can make it easier to create data sonifications by allowing developers to declare sonification designs with a few keywords rather than leaving them tedious jobs like inspecting online code and adjusting it to get ad-hoc solutions. To design effective data sonifications, developers still need to learn relevant knowledge from empirical studies, just as being able to use visualization grammars like D3.js [] , Vega-Lite [] , and ggplot2 [] do not necessarily mean one can easily create effective visualizations. To support developers in authoring useful sonifications, future work could explore more intelligent approaches like automated design recommenders for different purposes like data analytics, data journalism, and data art.
8.4. Limitations
While our primary contribution is the Erie grammar, a usable player could make it easier to learn the grammar and apply it to different applications. We provide an online player for sonifications backed by Erie with baseline functionalities like playing a single queue and showing audio queue tables. As Erie is an open-source project, extensions for more player controls (e.g., playing a single sound) could benefit sonification developers and users with respect to debugging and navigation. Next, intending Erie as a low-level toolkit for sonification developers to use, we prioritized independence from visualization, expressiveness, and compatibility with audio programming standards. As Erie is not a walk-up-and-use tool, future work could benefit from reflecting on use cases from longer term observations of developer communities.
9. Conclusion
Erie is a declarative grammar for data sonification design that supports expressing audio channels as data encodings. Erie supports various auditory encoding channels, such as pitch, tapping, and modulation index, and different instruments for sound tones like a simple oscillator, musical instruments, and synths. Furthermore, we implemented and open-sourced Erie's spec API, compiler, and player for the web audio environment, and they offer extension methods using audio filters and custom encoding channels. By providing a variety of examples and replicating existing sonification use cases, we demonstrated the expressiveness of Erie grammar and the technical feasibility of our implementations. We expect Erie to support various data sonification research and produce further understanding in auditory perception of data, which will in turn help extend Erie's capabilities.
Footnotes
References
Appendix A. Technical Details of Erie
This appendix details the Erie grammar.
A.1. Customizing a Tone
The tone of a single sonification design is defined in terms of instrument type, whether the sound is continued, and a set of audio filters. To use custom instruments to express diverse sonification designs, a developer can define new instruments using synth (for FM and AM synthesizer), wave (directly defining a wave function), and sampling (importing external audio files) objects in a top-level spec. The developer can apply custom instruments to the tone type and a timbre encoding channel by referencing their names.
A dataset typically exists as a set of data points; even if it represents a continuous distribution, its digital format is a set of approximated data points. Thus, a data representation should be able to capture the continuity or discreteness between data points (e.g., line chart vs. scatterplot). In the walkthrough, for example, we used a discrete () tone to indicate that each sound represents a discrete bin. On the other hand, a developer could use a continuous () tone for a sonification of a continuous distribution. A sound is discrete if it is momentarily paused and resumed as auditory values change (e.g., a sound "beep Beep BEEP" with varying loudness). A sound is continuous if it is not paused as its auditory values change (e.g., a sweeping sound "" with increasing pitch).
When more artistic sound effects (e.g., dynamic compression, distortion) are needed, a developer can apply them using the filter property of a tone. A filter object is an ordered list of filter names, and each filter is applied after the previous filter, reflecting how audio filters are commonly applied to electric sounds. Erie considers the properties of an audio filter (e.g., level of compression) as encoding channels so that a developer can configure audio filters both statically and dynamically (mapped to data variables). Our implementation offers several preset filters (e.g., dynamic compressor) and APIs for audio experts to define and use custom filters.
A.2. Encoding
Below, we detail how to indicate specific properties for different encoding channels and auxiliary or shortcut properties for diverse sonification designs.
A.2.1. Expressing time as an encoding
Time is to sonification as position is to visualization. An audio graph arranges its auditory values along a time axis. Erie expresses time as encoding to enable data-driven time control. For example, the start time of each sound can be mapped to a certain data variable.
The time axis of a sonification encodes data either in terms of the start and end times of a sound (time and time2) or the start time and duration of a sound (time and duration). On the one hand, two data variables sharing the same unit (e.g., monthly lowest and highest temperature) can be mapped to start and end times. On the other hand, two data variables with different units (e.g., country names and CO2 emissions) can be mapped to start time and duration. Erie supports expressing when a sound starts and ends (time + time2) or when and how long it is played (time + duration).
The length of a sonification is also the range of its time channel. Thus, Erie provides another shortcut, length, for the range of time scale (i.e., ). When there is no need to encode end time or duration, time channel can have band to set the duration of each sound uniformly (for discrete tones).
Erie makes a distinction between when a sound starts (the value of the time channel) and how a sound is timed in relation to other sounds (timing). For example, a developer wants a sound to be played after the previous sound (relative), to start on an exact time (absolute), or to start with the other sounds (simultaneous). To control how a time channel assigns times, the developer can use the timing property of the time channel's scale. The above extensions to the time channel's scale is formalized as:
These time-related channels and the timing option produce the following high-level combinations:
Case 1: . A time channel with a fixed scale.band value defines sounds with a fixed duration () and start times varied by the encoded data variable (). If scale.timing is simultaneous, then all of the sounds are played at the same time.
Case 2: . Using both time and duration channels defines sounds with varying durations and start times.
Case 3: . A time channel with absolute timing and a time2 channel specify sounds with varying start and end times. Note that the two fields mapped to the time and time2 channel must be defined on the same data unit, such as bin start and endpoints.
A.2.2. Channel-specific properties
Specific auditory encoding channels may have different physical constraints that need channel-specific properties in addition to the above definition. Erie considers such physical constraints in defining encodings for canonical auditory channels. For example, pitch can have raw pitch frequency values or have them rounded to musical notes. To enable this rounding, a developer can set round-to-note to true for the pitch channel.
A.2.3. Providing auditory reference elements
Tick for time channel. A longer sonification may need to provide a sense of the progression of time as Cartesian plots have axis ticks and grids. To do so, a developer could use a tick sound that repeats every certain time interval. The developer can define a tick directly in the time channel or refer to a tick definition in the top-level tick.
Scale description markup. As we use legends for data
visualizations, it is important to provide the overview of the scales used
in a sonification~[]
. The
description
of a scale can be skipped, defined as a default audio legend set by a compiler,
or customized. To customize a scale description, Erie
employs a markup expression that can express literal texts, audio legends (), and reserved keywords, such
as
A.2.4. Inline transform
Inspired by Vega-Lite~[] , it is possible to provide an inline data transform: aggregate or bin. This is a shortcut for defining a corresponding transform item and use the resulting variables in the channel's field. For example, the separately defined transforms in the walkthrough can be rewritten as: